PPL Electric Utilities delivers electricity to more than 1.4 million homes and businesses in central and eastern Pennsylvania. According to their website, the company regularly ranks among the country’s best utility companies for reliability and customer satisfaction.
Are you concerned about rate changed for your region or thinking about your plan? Learn more about PPL and their price to compare.
Areas Served by PPL Electric Utilities
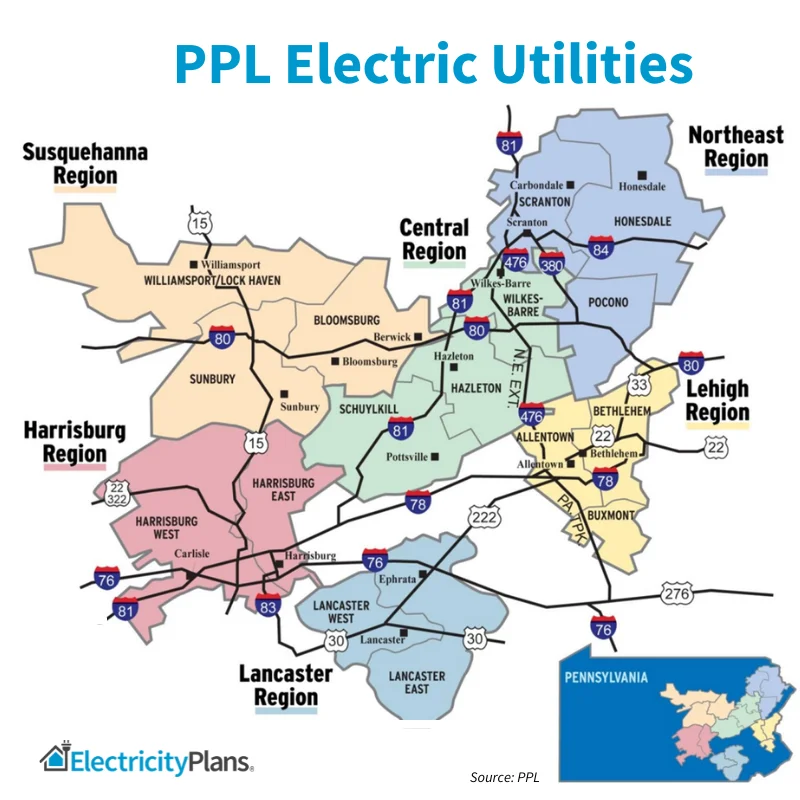
PPL Electric is your utility company if you live in Lancaster, Harrisburg, Bethlehem, Allentown, Berwick and many other cities in eastern Pennsylvania. The map for this utility region is shown below.
You can pay the PPL default rate, also known as the price to compare, or you can shop rates from a competitive electric supplier.

Compare PPL Electricity Rates vs. PPL Price to Compare
| PPL Electric Utilities’s residential Price to Compare for the generation supply portion of your bill is 12.953¢/kWh from December 1, 2025 – May 31, 2026. Compare that to the supplier rates below. | ||||
| Plan Name | Term | Rate/kWh | ||
|---|---|---|---|---|
| Think Basic 3 | 3 | 12.44 ¢ | ||
| Direct Energy Live Brighter 11 | 11 | 12.69 ¢ | ||
| APG&E True Classic 4 | 4 | 12.70 ¢ | ||
| Direct Energy Live Brighter 12 | 12 | 12.79 ¢ | ||
| XOOM Energy Sure Lock 6 | 6 | 12.89 ¢ | ||
| Energy Harbor Safe Harbor Value 9 | 9 | 13.19 ¢ | ||
| APG&E True Classic 11 | 11 | 13.40 ¢ | ||
| Direct Energy Live Brighter 18 | 18 | 13.59 ¢ | ||
| Energy Harbor Safe Harbor Value 12 | 12 | 13.89 ¢ | ||
| APG&E True Classic 12 | 12 | 13.90 ¢ | ||
Energy Choice Lets You Shop for Suppliers
PPL Electric Utilities is part of the Pennsylvania electricity choice program.
Pennsylvania was the first state to deregulate energy delivery, launching a more competitive marketplace for electricity suppliers in the mid-1990s and giving gas providers a similar treatment toward the end of the decade. Today, Pennsylvania residents have two ways to purchase electricity: directly through a utility provider or through an alternative supplier.
Under this program, you can shop for an electricity supplier for your home or business, or you can get your power from the utility at the price to compare or default service rate. PA Power Switch has helped residents compare plans for their region; we go a step further by reviewing providers to help you find genuine deals free of fine print. Find an affordable electricity plan in Pennsylvania now.
Regardless of who you choose for your electricity supply, your utility will still deliver the power to your home, respond in an emergency and send your bill.
But, when you select an Electric Generation Supplier (EGS) you can usually lock in a competitive rate that gives you price certainty.
Shop PPL Electricity Rates By Zip Code
PPL Price to Compare Rate History
The PPC price to compare or rate to compare is updated on June 1st and December 1st each year. It’s the rate you pay if you don’t choose an electricity supplier.
In the chart below you’ll find the price to compare current and historic rates. The historic rates show a recent sharp increase in the cost of electricity for residential customers.
| Effective Date | Price to Compare |
|---|---|
| December 1, 2025 - May 31, 2026 | 12.953¢ |
| June 1, 2025 - November 30, 2025 | 12.491¢ |
| December 1, 2024 - May 31, 2025 | 10.771¢ |
| June 1, 2024 - November 30, 2024 | 10.040¢ |
| December 1, 2023 - May 31, 2024 | 11.028¢ |
| June 1, 2023 - November 30, 2023 | 12.126¢ |
| December 1, 2022 - May 31, 2023 | 14.612¢ |
| June 1, 2022 - November 30, 2022 | 12.336¢ |
| January 1, 2022 - May 31, 2022 | 8.941¢ |
| December 1, 2021 - December 31, 2021 | 9.502¢ |
| December 1, 2020 - November 30, 2021 | 7.544¢ |
| June 1, 2020 - November 30, 2020 | 7.317¢ |
| December 1, 2019 - May 31, 2020 | 7.284¢ |
| June 1, 2019 - November 30, 2019 | 7.632¢ |
| December 1, 2018 - May 31, 2019 | 7.59¢ |
| June 1, 2018 - November 30, 2018 | 7.04¢ |
| December 1, 2017 - May 31, 2018 | 7.45¢ |
| June 1, 2017 - November 30, 2017 | 7.46¢ |
Here’s the PPL price to compare history in a graph format. You can easily see how the your utility electric rate changes. Recent historic prices show a big increase in utility rates.
Power Outage – Who to Call
If you have a power outage, you’ll contact your utility company for assistance.
- Report outage by text: Text “outage” to “TXTPPL”
- Report outage online
About PPL Electric Utilities
Dedicated to delivering power to customers in eastern and central Pennsylvania, PPL Electric originated over a century ago in 1920. Today, the company employs about 1,700 individuals who ensure their 1.5 million customers over 29 counties receive safe, uninterrupted electricity.
Beyond setting rates:
- PPL Electric Utilities helps maintain the region’s network of power lines and equipment: In addition to clearing vegetation and installing newer lines, substations and poles, their investment in smart grid technology has reduced outages by 30% over the past decade.
- Attentive customer service isn’t just a principle — it’s backed by 30 J.D. Power and Associates awards.
- Supporting customers goes beyond hiring representatives to answer questions. PPL Electric encourages its customers to adopt more renewable energy solutions, and during the pandemic, the company launched a bill payment program to help those struggling financially keep their lights on.
